from IPython.display import HTML

HTML('''<script>
code_show=true;
function code_toggle() {
if (code_show){
$('div.input').hide();
} else {
$('div.input').show();
}
code_show = !code_show
}
$( document ).ready(code_toggle);
</script>
<form action="javascript:code_toggle()"><input type="submit" value="Hide/Show code blocks"></form>''')
import pandas as pd
import quandl
import math

I_FILE = './CVE Income Statement.csv'
BS_FILE = './CVE Balance Sheet.csv'
CF_FILE = './CVE Cash Flow.csv'
TRADING_DATE = '2018-03-19'
SHARE_CURRENCY = 'USD'
FIN_CURRENCY = 'CAD'
SHR_FIN_EXCHANGE_RATE = 1.29
PRICE_PER_SHARE = 8.45
TOTAL_SHARES = 500

FIRST_YEAR = 2013
LAST_YEAR = 2017
LAST_FIELD = '2017-12'

# In million USD
MARKET_CAP = 10494

# In million shares
SHARES_OUTSTANDING = 1229

i_df = pd.read_csv(I_FILE, index_col=0, header=1, mangle_dupe_cols=True)
bs_df = pd.read_csv(BS_FILE, index_col=0, header=1)
cf_df = pd.read_csv(CF_FILE, index_col=0, header=1)

def fnum(num):
    """ Format number 1000 to 1,000"""
    return "{0:,.0f}".format(int(num))

def fnum1(num):
    """ Format number 0.501231323 to 0.50"""
    return "{0:,.2f}".format(num)

def get_value(df, field, month=LAST_FIELD):
    if field not in df.index:
#         print(field, "not found")
        return 0.0
    else:
        value = df.loc[[field], month].iloc[0]
        if math.isnan(value):
#             print(field, "is NaN")
            value = 0.0
        return value

def get_mean(df, field):
    value = df.loc[[field]].iloc[0, :5].mean()
    return value

# Share price for calculation i.e. in Financial report's currency.
shr_price = PRICE_PER_SHARE * SHR_FIN_EXCHANGE_RATE

# This is calculated in share's currency as it is display-only.
total_purchase = PRICE_PER_SHARE * TOTAL_SHARES

# Earnings per Share - Diluted
eps_last = i_df.loc[['Diluted'], '2017-12'].iloc[0]
eps_1 = i_df.loc[['Diluted'], '2013-12'].iloc[0]
eps_2 = i_df.loc[['Diluted'], '2014-12'].iloc[0]
eps_3 = i_df.loc[['Diluted'], '2015-12'].iloc[0]
eps_4 = i_df.loc[['Diluted'], '2016-12'].iloc[0]
eps_mean = i_df.loc[['Diluted']].iloc[0, :5].mean()

# Weighted Average Shares Outstanding - Diluted
shares_last = i_df.loc[['Diluted'], '2017-12'].iloc[1]
shares_mean = i_df.loc[['Diluted']].iloc[1, :5].mean()

# Total Stockholders' Equity or Book Value
book_last = bs_df.loc[["Total Stockholders' equity"], '2017-12'].iloc[0]
book_1 = bs_df.loc[["Total Stockholders' equity"], '2013-12'].iloc[0]
book_2 = bs_df.loc[["Total Stockholders' equity"], '2014-12'].iloc[0]
book_3 = bs_df.loc[["Total Stockholders' equity"], '2015-12'].iloc[0]
book_4 = bs_df.loc[["Total Stockholders' equity"], '2016-12'].iloc[0]
book_mean = bs_df.loc[["Total Stockholders' equity"]].iloc[0, :5].mean()

# Book to Share
bs_last = book_last / SHARES_OUTSTANDING
bs_mean = book_mean / SHARES_OUTSTANDING

# Price to Book ratio
pb_last = shr_price / bs_last
pb_mean = shr_price / bs_mean

# Price to Earnings ratio
pe_last = shr_price / eps_last
pe_mean = shr_price / eps_mean

# Operational Earnings per share
oes_last = cf_df.loc[["Net cash provided by operating activities"], '2017-12'].iloc[0]
oes_mean = cf_df.loc[["Net cash provided by operating activities"]].iloc[0, :5].mean()

# Price to Operational Earnings ratio
poe_last = MARKET_CAP / oes_last
poe_mean = MARKET_CAP / oes_mean

# Dividends
dvd_last = -1*cf_df.loc[["Cash dividends paid"], '2017-12'].iloc[0]
dvd_1 = -1*cf_df.loc[["Cash dividends paid"], '2013-12'].iloc[0]
dvd_2 = -1*cf_df.loc[["Cash dividends paid"], '2013-12'].iloc[0]
dvd_3 = -1*cf_df.loc[["Cash dividends paid"], '2013-12'].iloc[0]
dvd_4 = -1*cf_df.loc[["Cash dividends paid"], '2013-12'].iloc[0]
dvd_mean = -1*cf_df.loc[["Cash dividends paid"]].iloc[0, :5].mean()

# Earnings Manipulation Detection with Scaled Net Operating Assets (SNOA)
total_assets = bs_df.loc[["Total assets"], '2017-12'].iloc[0]
cash_eq = bs_df.loc[["Cash and cash equivalents"], '2017-12'].iloc[0]
op_assets = total_assets - cash_eq

st_debt = get_value(bs_df, "Short-term debt")
lt_debt = get_value(bs_df, "Long-term debt")
minority_interest = get_value(bs_df, "Minority interest")
preferred_stock = get_value(bs_df, "Preferred stock")
total_liabilities = get_value(bs_df, "Total liabilities")
net_assets = total_assets - total_liabilities # == book common equity

op_liabilities = total_assets - st_debt - lt_debt - minority_interest - preferred_stock - net_assets

total_assets_prev = get_value(bs_df, "Total assets", month='2016-12')
snoa = (op_assets - op_liabilities) / float(total_assets_prev)
Overview
Trading date: {{TRADING_DATE}}
Price per share: {{SHARE_CURRENCY}} {{fnum1(PRICE_PER_SHARE)}}
Total shares: {{TOTAL_SHARES}}
Total purchase: {{SHARE_CURRENCY}} {{fnum(total_purchase)}}

Market Cap: {{fnum(MARKET_CAP)}} (in million USD)

Scaled Net Operating Assets: {{fnum1(snoa)}}
Website: https://www.cenovus.com/
A Canadian oil company that got bashed over its acquisition of assets from ConocoPhilips in May 17, 2017. The asset was worth almost \$18b while the entire company was worth \$15b. Shareholders were enraged over the fact that a part of the deal were purchased by issuing common stocks (thereby diluting shareholder shares in the process). They were also worried about the amount of debt they used to finance this purchase.
Relevant news:
- Cenovus completes acquisition of assets in Western Canada from ConocoPhillips
- Cenovus shareholder calls for board shakeup over Conoco deal.
Fundamental Data
Fundamental data were gathered from Morningstar. Screenshots are available in the Appendixes section of this article. In this section, we will get into the details of our analysis and our considerations.
All prices are in millions {{FIN_CURRENCY}}.
P/B Ratio
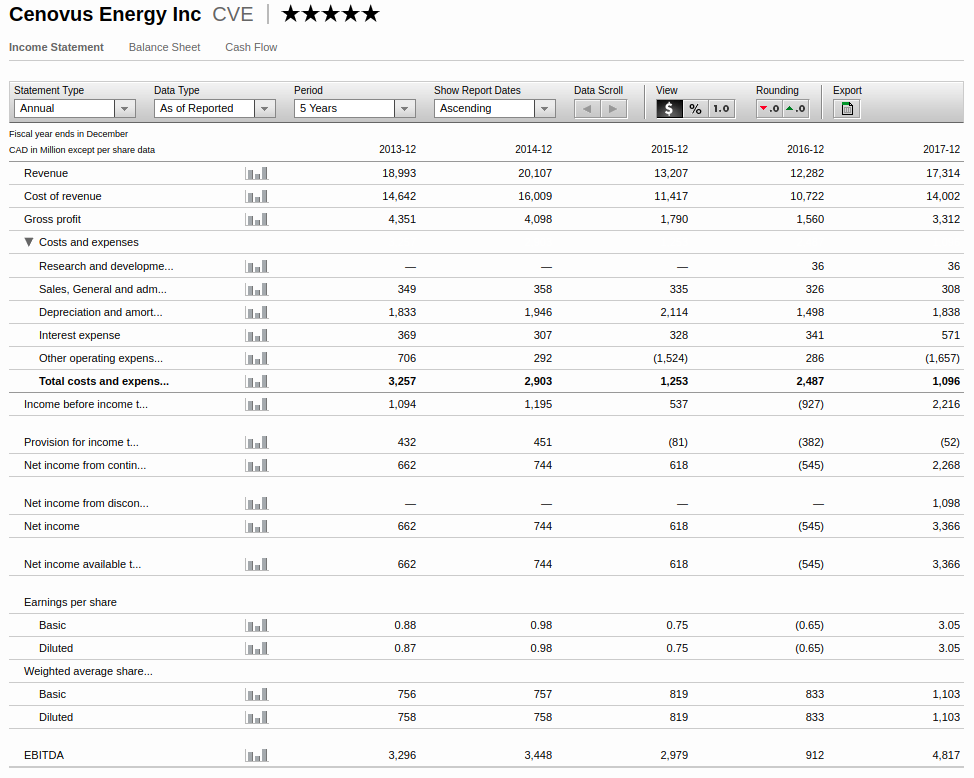
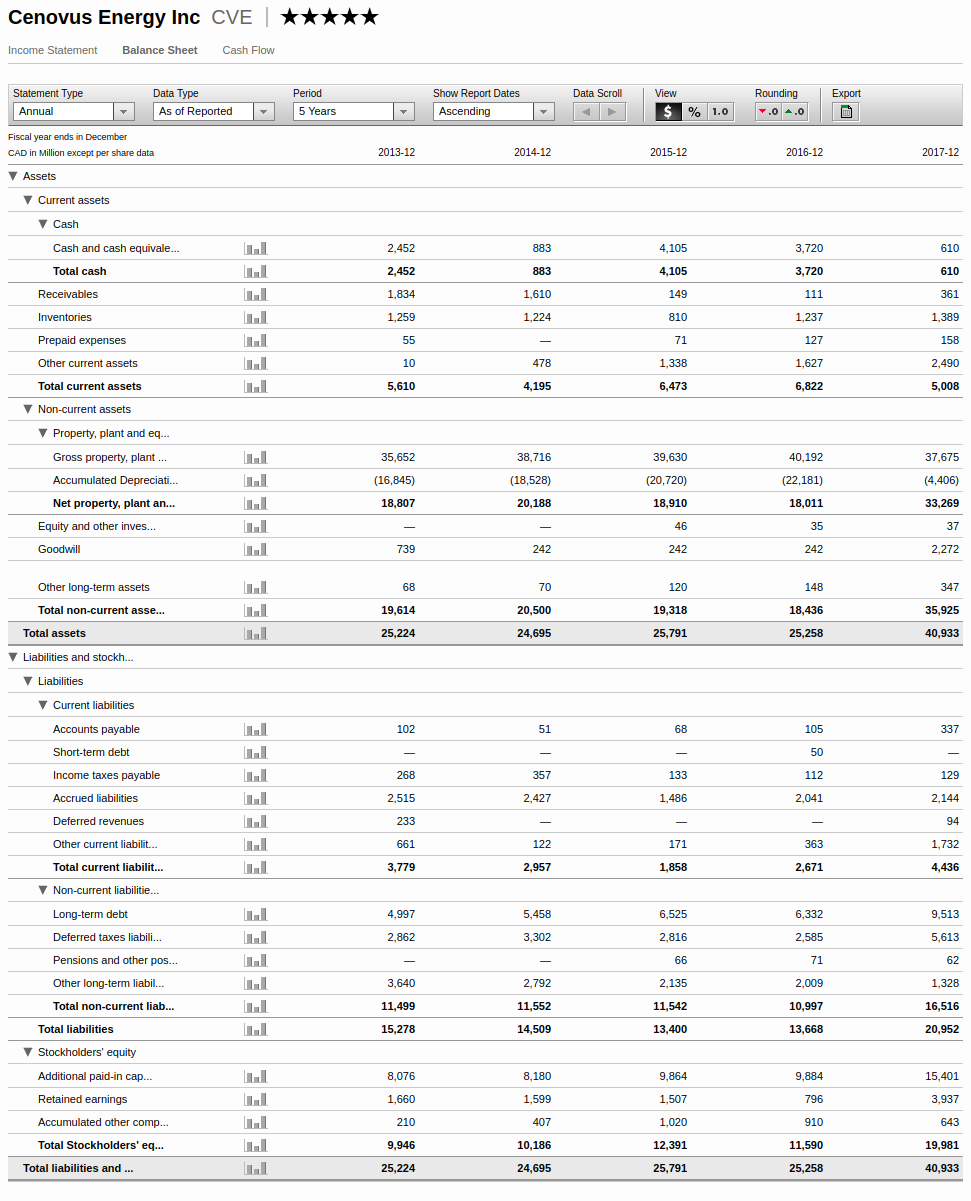
- Mean Book Value ({{FIRST_YEAR}} - {{LAST_YEAR}}): {{fnum(book_mean)}} ({{fnum(book_1)}}, {{fnum(book_2)}}, {{fnum(book_3)}}, {{fnum(book_4)}}, {{fnum(book_last)}})
- P/B Ratio (mean): {{fnum1(pb_mean)}}
- P/B Ratio ({{LAST_YEAR}}): {{fnum1(pb_last)}}
P/B ratio of the last year was much less than 1.0 which means the assets are likely to cover all common shares. The significant increase between 2016 and 2017 shown an increase in assets as described in 2017 annual report.
P/E Ratio
- Mean Earnings per Share ({{FIRST_YEAR}} - {{LAST_YEAR}}): {{fnum1(eps_mean)}} ({{fnum1(eps_1)}}, {{fnum1(eps_2)}}, {{fnum1(eps_3)}}, {{fnum1(eps_4)}}, {{fnum1(eps_last)}})
- P/E Ratio (mean): {{fnum1(pe_mean)}}
- P/E Ratio ({{LAST_YEAR}}): {{fnum1(pe_last)}}
- Price / Operational Earning Ratio (mean): {{fnum1(poe_mean)}}
- Price / Operational Earning Ratio ({{LAST_YEAR}}): {{fnum1(poe_last)}}
P/E Ratio was under 15 times, still considered cheap. We also tried using Operational Earnings as denominator with which we hoped to capture a more accurate view of the company's earnings.
Annual Report 2017
Interesting quotes:
2017 was a year of significant change for Cenovus, where we gained full ownership of our oil sands assets, acquired an additional core operating area in the Deep Basin and divested the majority of our legacy Conventional assets. On May 17, 2017, we acquired from ConocoPhillips Company and certain of its subsidiaries (collectively, “ConocoPhillips”) their 50 percent interest in the FCCL Partnership (“FCCL”), and the majority of ConocoPhillips’ western Canadian conventional assets in the Deep Basin in Alberta and British Columbia for total consideration of $17.9 billion (“the Acquisition”).
This paragraph describes the assets that were purchased.
In December 2017, we also commenced marketing for sale certain non-core assets located in the East and West Clearwater areas of the Deep Basin, representing approximately 15,000 BOE per day of production, to further streamline our portfolio and deleverage our balance sheet.
Over the course of 2017, Cenovus has transitioned its asset base and strategy to support focused development in the oil sands and Deep Basin, providing opportunities for disciplined growth and long-term cash flow generation.
Change of strategy, focusing on core business.
At the same time, investor concern about the Acquisition, volatile commodity prices and a number of other factors contributed to a more than 40 percent decline in our share price.
This sentence may be cross-checked with the news articles above.
Over the last few months, Cenovus has made considerable progress in reducing debt and is taking steps to right-size the Company for the current environment. Effective November 6, 2017, Alex Pourbaix was appointed Cenovus’s President and Chief Executive Officer, and he subsequently announced changes to the senior leadership team in December 2017.
Just an interesting note about the change of management.
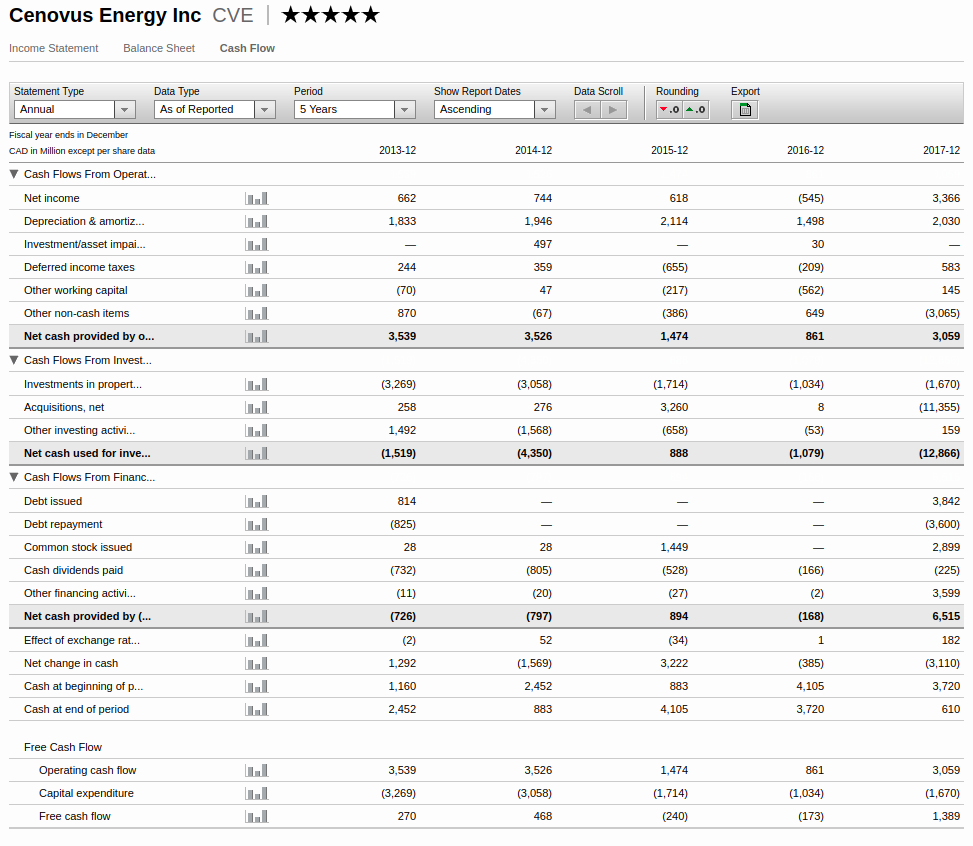
Dividends
- Mean dividends paid ({{FIRST_YEAR}} - {{LAST_YEAR}}): {{dvd_mean}} ({{fnum1(dvd_1)}}, {{fnum1(dvd_2)}}, {{fnum1(dvd_3)}}, {{fnum1(dvd_4)}}, {{fnum1(dvd_last)}})
Industry Outlook
One of the risks with this investment is if the world is moving away from oil usage. Some studies:
Quora answer by Berkeley professor Richard A Muller (positive. We will stick with oil for some good years ahead):
The advantages of gasoline are so great, that I predict we will stick with it for mobile transportation. We will cut its CO2 emissions in half, maybe by ⅔, by more efficient automobiles. We will attack CO2 emissions primarily in industry and electric power generation by severely reducing the use of coal. Coal will be replaced by energy conservation (“megawatts”), shale gas, and nuclear power. Solar and wind will contribute, but not as much as many people would like, because their expense will remain too high for most of the developing world. I expect that the major use of coal will eventually become the manufacture of gasoline. Yes, it will still contribute to global warming, but at a pace that is much reduced.
I am not advocating this future. I am simply trying to evaluate objectively the direction that I see an economically-driven world moving. Most of the world will use oil because of its low expense and convenience. The pace of global warming will slow as we use fossil fuels more efficiently and build nuclear capability, and most of the developing countries will decide that adaptation to increased warmth is a better option than expensive and inconvenient energy.
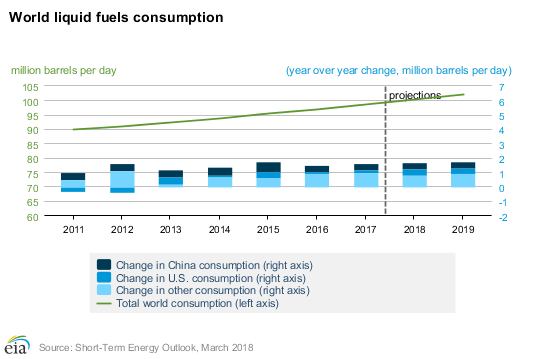
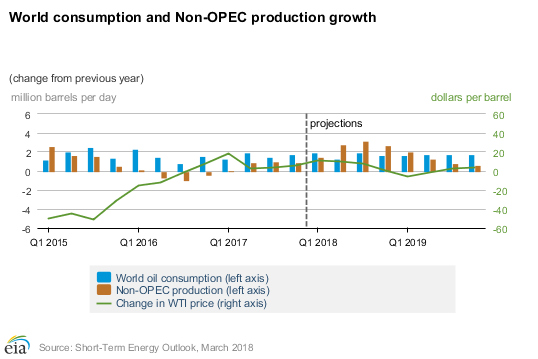
Oil usage and projection statistics (negative. The demand projection stagnates, while supply would be excessive):
i_df
bs_df
cf_df